Building Databricks Medallion Pipelines with DynamoDB – Part 3: Gold Layer, Aggregations, and Event‑Driven Orchestration

In Part 1, you ingested raw data from Amazon DynamoDB into a Bronze Delta table, preserving the source truth with minimal transformation. In Part 2, you transformed that Bronze data into a Silver layer: applying data quality rules, enforcing schemas, cleaning fields, deduplicating records, and enriching transactions with customer attributes.
In this 3rd part, the focus is on the Gold layer and orchestration:
- What the Gold layer is and how it differs from Silver.
- How to aggregate Silver data into business‑ready metrics (daily sales, customer lifetime value).
- How to serve Gold data both from Delta and back into DynamoDB for APIs.
- How to orchestrate Bronze → Silver → Gold with event‑driven workflows using file arrival and table update triggers.
- How to think about observability, performance, and the future of managed ingestion.
Gold layer: curated business products
The Gold layer is the final refinement step in the Medallion architecture. While Silver focuses on integration and quality across domains, Gold is explicitly business‑oriented.
What Gold is optimized for
Gold tables are designed to serve specific business use cases:
- Dashboards and BI tools (Power BI, Tableau, Databricks SQL).
- Executive and product KPIs (revenue, churn, marketing conversion).
- ML features and scoring tables (e.g., customer propensity, risk scores).
- Operational APIs that need low‑latency access to curated metrics.
Common characteristics:
- Aggregated: e.g., daily revenue per region, monthly active users, customer lifetime value.
- Denormalized: often structured as star schemas (fact + dimension tables).
- Performance‑tuned: partitioning, clustering (Z‑Order), and indexing to support interactive queries.
Conceptually:
- Bronze cares about completeness.
- Silver cares about correctness.
- Gold cares about usefulness and performance for specific business questions.
2. Gold aggregations: from Silver to metrics
Assume you have the Silver transactional table from Part 2, stored at:
1
s3a://my-data-lake/silver/customer_transactions
with columns such as:
txn_id,cust_id,txn_amount,txn_dateproduct_category_clean,customer_segment,region,country- metadata like
_ingestion_timestamp,_processed_timestamp
From here, you can create two key Gold products:
- A daily sales summary table (by date, category, segment, region).
- A customer lifetime value (LTV) table (per customer).
Daily sales summary
1
2
3
4
5
6
7
8
9
10
11
12
13
14
15
16
17
18
19
20
21
22
23
24
25
26
27
28
29
30
31
32
from pyspark.sql.functions import (
    col, sum as spark_sum, countDistinct, avg,
    percentile_approx, stddev
)

print("Reading silver layer data...")
silver_df = spark.read.format("delta").load(
    "s3a://my-data-lake/silver/customer_transactions"
)

print(f"Silver records: {silver_df.count():,}")

print("\nCreating daily sales summary by category and segment...")

daily_sales_gold = silver_df.groupBy(
    col("txn_date").alias("sales_date"),
    col("product_category_clean").alias("product_category"),
    col("customer_segment"),
    col("region")
).agg(
    # Revenue metrics
    spark_sum("txn_amount").alias("total_revenue"),
    avg("txn_amount").alias("avg_transaction_value"),

    # Volume metrics
    countDistinct("txn_id").alias("transaction_count"),
    countDistinct("cust_id").alias("unique_customers"),

    # Distribution metrics
    percentile_approx("txn_amount", 0.95).alias("p95_transaction_value"),
    stddev("txn_amount").alias("revenue_std_dev")
)
High‑level what this does:
- Reads the trusted Silver data.
- Groups rows by
txn_date, product category, customer segment, and region. - Computes summary metrics for each group (total revenue, number of transactions, unique customers, and distribution stats).
PySpark methods:
.groupBy(cols...)– groups rows by one or more key columns, like SQLGROUP BY..agg(...)– applies aggregation functions over each group.sum/spark_sum– sums values in a numeric column (renamed here to avoid name clash with Python’s built‑insum).avg– computes the average for a numeric column.countDistinct– counts distinct values in a column (e.g., number of unique customers).percentile_approx(col, p)– estimates the p‑th percentile (e.g., 0.95) of a numeric column; useful for understanding skew and outliers.stddev– standard deviation, another measure of variability.
This transforms many detailed transaction rows into a compact, analytics‑friendly set of daily records.
Customer lifetime value (LTV) table
1
2
3
4
5
6
7
8
9
10
11
12
13
14
15
16
17
18
19
from pyspark.sql.functions import max as spark_max, min as spark_min, datediff

print("Creating customer lifetime value metrics...")

customer_metrics_gold = silver_df.groupBy("cust_id").agg(
    # Monetary value
    spark_sum("txn_amount").alias("lifetime_value"),
    avg("txn_amount").alias("avg_transaction_value"),

    # Frequency
    countDistinct("txn_id").alias("total_transactions"),
    countDistinct("txn_date").alias("transaction_days"),

    # Recency
    spark_max("txn_date").alias("last_purchase_date"),
    spark_min("txn_date").alias("first_purchase_date"),
    (datediff(spark_max("txn_date"), spark_min("txn_date")) /
     (countDistinct("txn_date") + 1)).alias("avg_days_between_purchases")
)
What this does:
- Groups records per
cust_id(per customer). - Computes:
- Lifetime value: total revenue from the customer.
- Average transaction value.
- Frequency: number of transactions and number of days they transacted.
- Recency window: first and last purchase dates, and average days between purchases.
PySpark methods:
spark_max/spark_min– maximum and minimum values, respectively; here used for the first and last purchase dates.datediff(end, start)– number of days between two dates.
This table is ideal for:
- Segmentation (high‑value vs low‑value customers).
- Churn analysis (customers who haven’t purchased in a long time).
- Feeding ML models (propensity to buy, risk scoring, etc.).
Writing Gold tables
Once you have daily_sales_gold and customer_metrics_gold, you write them as Gold Delta tables.
1
2
3
4
5
6
7
8
9
10
11
12
13
14
15
16
17
18
19
20
print("\nWriting gold layer tables...")

# Daily sales summary
daily_sales_gold.write \
    .format("delta") \
    .mode("overwrite") \
    .option("overwriteSchema", "true") \
    .partitionBy("sales_date") \
    .save("s3a://my-data-lake/gold/daily_sales_summary")

print(f"  ✓ Daily sales summary: {daily_sales_gold.count():,} records")

# Customer metrics
customer_metrics_gold.write \
    .format("delta") \
    .mode("overwrite") \
    .option("overwriteSchema", "true") \
    .save("s3a://my-data-lake/gold/customer_metrics")

print(f"  ✓ Customer metrics: {customer_metrics_gold.count():,} records")
Key points:
- Format:
delta– you still get ACID guarantees, schema evolution, and time travel. - Mode:
overwrite– for Gold, it’s common to completely rebuild the aggregations at each run (e.g., daily). - Schema overwrite:
overwriteSchema=true– allows schema changes when needed (use carefully in production). - Partitioning:
partitionBy("sales_date")– speeds up queries that filter by date (e.g., “last 30 days”).
These Gold tables are now ready for consumption by SQL, BI dashboards, and ML workloads.
Serving Gold data: Delta and DynamoDB
Gold data often needs to be accessed in two very different ways:
- Analytical (ad‑hoc queries, dashboards, notebooks): large scans, aggregates, complex joins.
- Operational (microservices, APIs, mobile apps): fast key‑based reads, small results.
Delta for analytics
Delta tables are ideal for:
- BI tools (Databricks SQL, Power BI, Tableau).
- Ad‑hoc exploration by data analysts.
- Long‑running analytical queries and ML training sets.
You can expose Gold tables through Unity Catalog and let BI tools query them directly over SQL.
Writing Gold to DynamoDB for APIs
If your front‑end systems or microservices live close to DynamoDB, it’s often useful to publish Gold metrics back into DynamoDB for low‑latency lookups.
A simple pattern:
1
2
3
4
5
6
7
8
9
10
gold_df = spark.read.format("delta").load(
    "s3a://my-data-lake/gold/daily_sales_summary"
)

gold_df.write.format("dynamodb") \
    .option("dynamodb.table", "daily_sales_metrics") \
    .mode("overwrite") \
    .save()

print("✓ Wrote daily sales metrics to DynamoDB")
Here:
- You read the Gold Delta table.
- Write each row into a DynamoDB table (
daily_sales_metrics), which can be keyed by date + category + region.
For high volumes, you can implement a more advanced pattern that temporarily scales DynamoDB write capacity up, writes data, then scales it down again to control cost and avoid throttling.
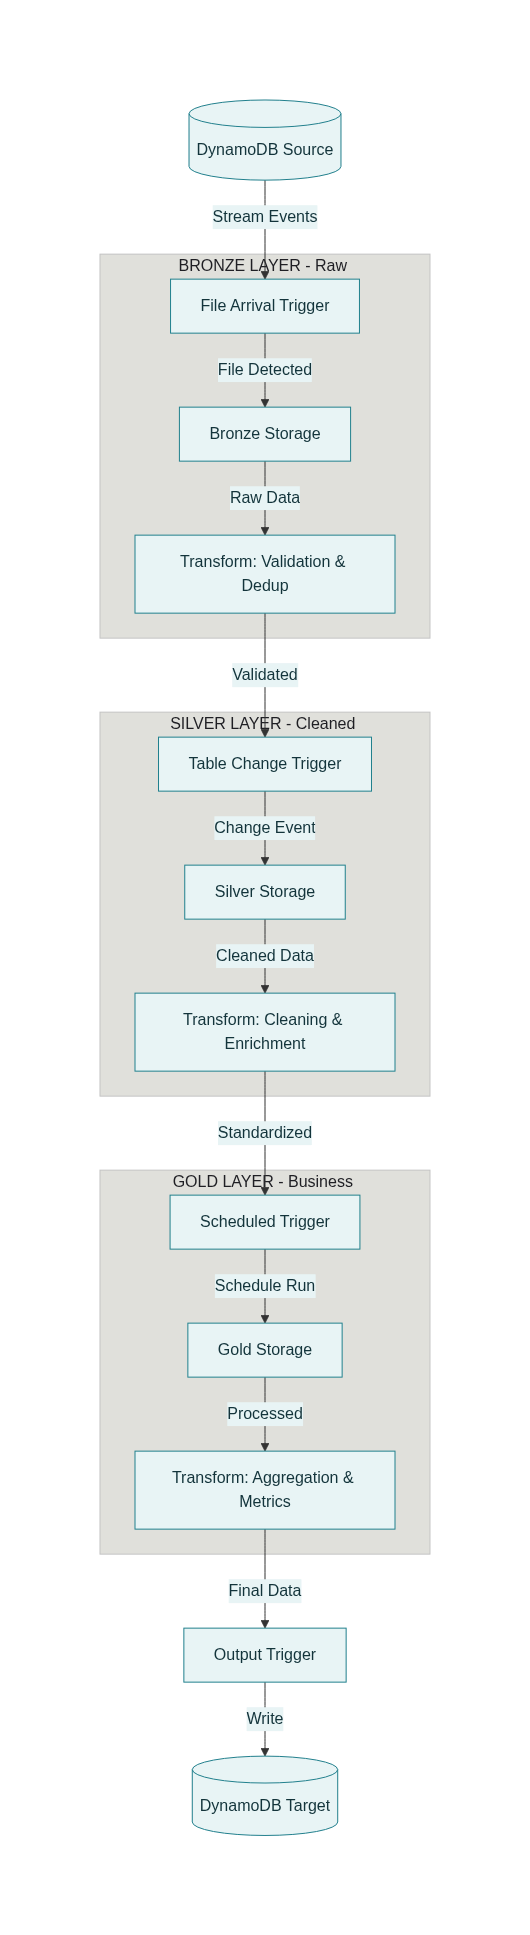
Event‑driven orchestration: Bronze → Silver → Gold
So far, each stage (Bronze, Silver, Gold) has been shown as code you run manually or via a simple schedule. In production, you want the pipeline to be event‑driven:
- New data lands in S3 → Bronze ingestion runs.
- Bronze is updated → Silver transformation runs.
- Silver (or Bronze) is updated or a day ends → Gold aggregation runs, then writes back to DynamoDB.
Trigger types
Databricks workflows support multiple trigger types relevant to Medallion pipelines:
- File arrival trigger
- Watches a cloud storage path (e.g.,
s3a://raw-input/transactions/). - Starts a job when new files are detected.
- Ideal for Bronze ingestion when DynamoDB exports to S3.
- Watches a cloud storage path (e.g.,
- Table update trigger
- Watches Delta tables in Unity Catalog for new commits (INSERT, MERGE, DELETE).
- Starts a job when the source table changes.
- Ideal for Silver and Gold jobs that must react to upstream updates.
- Can be configured with cooldowns and “wait after last change” to avoid flapping.
- Scheduled (cron) trigger
- Runs jobs on a fixed schedule (e.g., daily at midnight).
- Useful for reports that only need daily refresh even if upstream data is more frequent.
- Continuous
- Jobs that are always running for real‑time structured streaming use cases.
Combining these, you can create a multi‑hop event‑driven DAG.
Example high‑level workflow
A typical workflow might look like this:
- Task: bronze_ingest
- Trigger: file arrival in
s3a://raw-input/transactions/. - Work: read new DynamoDB exports → write to Bronze Delta table.
- Trigger: file arrival in
- Task: silver_transform
- Depends on:
bronze_ingest. - Trigger: table update on
bronze.customer_transactions. - Work: apply validation, cleaning, enrichment → write to Silver table.
- Depends on:
- Task: gold_aggregation
- Depends on:
silver_transform. - Trigger: either a daily schedule (e.g., midnight) or another table update on Silver.
- Work: aggregate into daily sales and customer_metrics tables.
- Depends on:
- Task: dynamodb_output
- Depends on:
gold_aggregation. - Trigger: dependency completion (i.e., runs when Gold finishes).
- Work: write aggregated metrics back to DynamoDB.
- Depends on:
Conceptually, you get:
1
2
3
4
S3 file arrival → Bronze job →
  Bronze table update → Silver job →
    Silver updated (or midnight) → Gold job →
      Gold complete → DynamoDB publish job
Each stage is loosely coupled via data events, not fixed cron times.
Operational excellence: performance, governance, and observability
Performance and throughput
For DynamoDB ingestion and serving, consider:
- Throughput management – ensure parallel scans or batch writes do not exceed DynamoDB capacity; use on‑demand mode or scaled‑up provisioned capacity during heavy runs.
- Filter pushdown – when possible, apply filters at the source to reduce data transferred (e.g., only recent partitions).
- Partitioning in Delta – partition by date or other high‑selectivity dimension to accelerate queries.
Governance with Unity Catalog
Unity Catalog provides a central governance layer for the Lakehouse:
- Manage permissions separately for Bronze, Silver, Gold layers (e.g., PII visible only in Bronze to a small group; anonymized Gold open to more users).
- Track lineage across tables: how data flowed from DynamoDB → Bronze → Silver → Gold → DynamoDB again.
Monitoring and observability
A production pipeline should be observable at multiple levels:
- Data quality metrics from Silver (rejection rates by rule).
- Pipeline metrics table storing records processed, duration, quality score per run.
- System tables and job logs for performance and cost analysis.
With these, you can define SLOs like:
- “Silver quality score must stay above 98%.”
- “Median Bronze ingest duration must be under 10 minutes.”
and alert when they are violated.
Looking ahead: managed connectors and AI‑assisted orchestration
The Databricks roadmap is moving toward more managed ingestion and AI‑assisted orchestration:
- Lakeflow Connect provides native, managed connectors that hide most of the complexity of CDC, schema evolution, and incremental ingestion from DynamoDB and other systems.
- Future orchestration engines are expected to:
- Automatically adjust ingestion rates based on data arrival patterns and cost.
- Suggest or even auto‑generate parts of your Medallion DAG based on lineage and workload history.
Even as these capabilities grow, the Medallion architecture remains relevant because it gives teams a clear mental model of how data quality and structure improve from Bronze to Silver to Gold.
Summary
In this 3rd part, you learned:
- The purpose of the Gold layer: business‑ready, aggregated, performance‑tuned tables for analytics and ML.
- How to create key Gold products: daily sales summary and customer lifetime value tables using PySpark aggregations.
- How to serve Gold data both from Delta for analytics and back into DynamoDB for low‑latency API access.
- How to build event‑driven orchestration using file arrival and table update triggers to automate the Bronze → Silver → Gold flow.
- Key considerations for operational excellence: throughput management, governance with Unity Catalog, and monitoring with data quality metrics.
- A glimpse into the future of managed ingestion and AI‑assisted orchestration on Databricks.
In the Part 4, we will delve into a complete, concrete Databricks Workflow JSON configuration. This configuration will illustrate how the Bronze, Silver, and Gold tasks are interconnected using event-driven triggers, specifically designed for streaming and incremental data processing. You will learn how to automate the entire pipeline, ensuring that data flows seamlessly from ingestion to transformation and aggregation, while maintaining high performance and observability. Read Part 4 →